In today’s data-driven world, a marketing dashboard is an indispensable tool for any business seeking to measure, analyze, and optimize its marketing efforts. A well-designed marketing dashboard provides a centralized, real-time view of key performance indicators (KPIs), empowering marketers to make informed decisions and demonstrate the impact of their campaigns. This article will guide you through the process of designing a marketing dashboard that effectively tracks your progress, identifies areas for improvement, and ultimately drives business growth. Learning how to design a marketing dashboard tailored to your specific needs is crucial for efficient reporting and effective strategy execution.
From choosing the right marketing metrics to selecting the ideal visualization tools, designing an effective marketing dashboard requires careful consideration. This comprehensive guide will equip you with the knowledge and best practices to create a powerful marketing dashboard. We will cover key steps, including identifying your marketing objectives, selecting relevant KPIs, and choosing the right dashboard software. Whether you are a seasoned marketing professional or just beginning your journey, this article will provide valuable insights into building a marketing dashboard that helps you achieve your marketing goals and demonstrate a clear return on investment (ROI).
What Should Be in a Marketing Dashboard?
A marketing dashboard should provide a clear and concise overview of your key performance indicators (KPIs). It’s not about cramming in every single metric, but rather focusing on the most impactful data that drives decision-making. This will vary depending on your specific marketing goals and objectives.
Typically, a good marketing dashboard includes metrics related to:
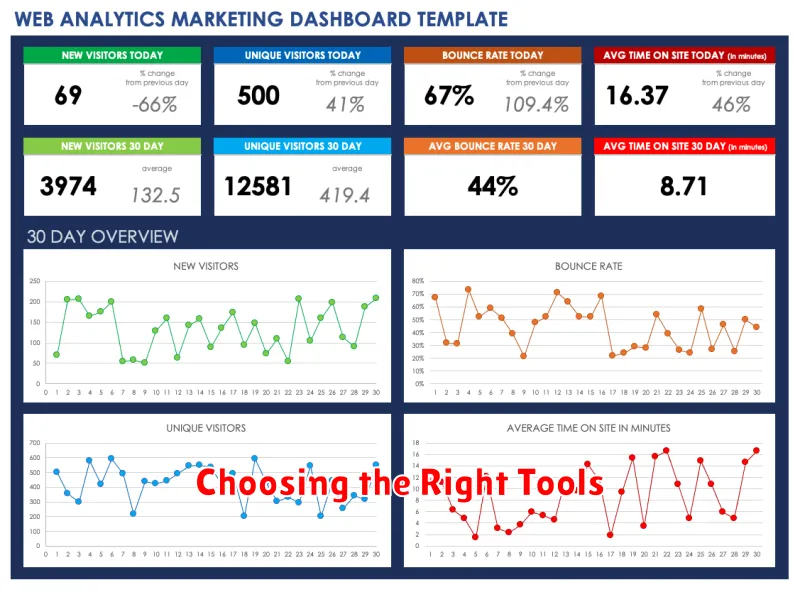
- Website Traffic: This encompasses metrics like unique visitors, page views, bounce rate, and average session duration. Understanding website traffic helps gauge the effectiveness of your digital presence.
- Lead Generation: Track metrics such as the number of leads generated through various channels, conversion rates, and cost per lead. This provides insights into the success of your lead generation efforts.
- Sales Performance: Monitor key sales metrics like revenue, conversion rates, average order value, and customer lifetime value. This helps connect marketing activities to bottom-line results.
- Campaign Performance: Analyze the performance of individual marketing campaigns by tracking metrics like reach, engagement, click-through rates, and conversions. This allows for optimization and improved ROI.
- Return on Investment (ROI): Measuring ROI is crucial to demonstrating the effectiveness of your marketing spend. Track how different channels and campaigns contribute to overall revenue.
By carefully selecting the most relevant KPIs, your marketing dashboard becomes a powerful tool for monitoring progress, identifying areas for improvement, and ultimately achieving your marketing goals. Remember to prioritize metrics that directly align with your business objectives.
Choosing the Right Tools

Selecting the appropriate tools is crucial for building an effective marketing dashboard. The right platform will depend on your specific needs, budget, and technical capabilities. Consider factors like data source integrations, visualization options, and reporting features.
Data Integration is paramount. Your chosen tool should seamlessly integrate with your existing marketing platforms, such as CRM systems, social media analytics, and website analytics. This eliminates manual data entry and ensures data accuracy.
Visualization Flexibility is key for clear communication. Look for tools that offer a variety of chart types, customizable dashboards, and interactive elements to present your data in a compelling and understandable manner. The ability to create custom calculations or metrics is also beneficial.
Reporting Capabilities are essential for analyzing performance. The platform should allow you to generate automated reports, schedule email deliveries, and easily share dashboards with stakeholders. Consider features like data filtering, drill-down functionality, and exportable reports.
Explore different options ranging from free tools like Google Data Studio to more robust paid solutions offering advanced analytics and automation. Carefully evaluate the features of each tool against your requirements to make an informed decision.
Visualizing KPIs Clearly
Effective visualization is crucial for a marketing dashboard’s success. A cluttered or poorly designed dashboard can obscure critical insights and hinder decision-making. Choose visualization methods that clearly represent your key performance indicators (KPIs) and their trends.
Consider the following visualization techniques:
- Line charts: Ideal for tracking trends over time, such as website traffic or conversion rates.
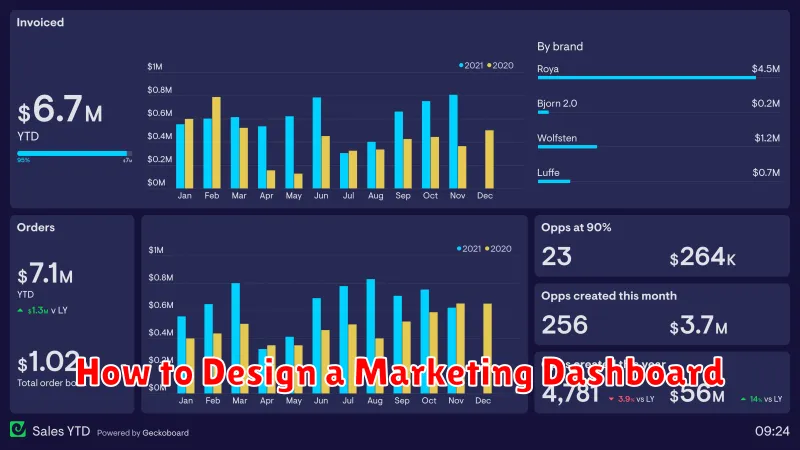
- Bar charts: Effective for comparing performance across different categories, like campaign performance or channel comparison.
- Pie charts: Useful for showing proportions and market share, though best used sparingly and with limited segments.
- Tables: Present precise numerical data and allow for detailed analysis. Use conditional formatting to highlight significant changes or performance thresholds.
- Gauge charts: Visualize progress toward a specific target, such as lead generation goals or sales quotas.
Prioritize clarity and avoid overwhelming the dashboard with excessive visuals. Consistency is key; use the same chart types for similar data across the dashboard. Ensure proper labeling of axes, data points, and legends to eliminate ambiguity. Color coding can also be employed strategically to highlight performance variations or draw attention to specific metrics.
Segmenting by Channel or Campaign
A crucial aspect of dashboard design is the ability to segment data by specific marketing channels or campaigns. This granular view allows marketers to understand which activities are driving the most significant results and identify areas for improvement.
Without segmentation, your data becomes a blended average that obscures the performance of individual efforts. Segmenting by channel (e.g., social media, email, paid search) allows you to compare their relative effectiveness in driving conversions or generating leads.
Segmenting by campaign offers even deeper insights. By isolating the data for each specific campaign, you can analyze its unique contribution to overall marketing objectives. This allows you to optimize budget allocation and refine future campaign strategies.
Consider implementing filter controls within your dashboard to easily switch between different segments. This interactivity allows for on-demand analysis and facilitates quick decision-making based on real-time performance data.
Automating Report Updates
A key benefit of a well-designed marketing dashboard is the ability to automate report updates. Manual reporting is time-consuming and prone to errors. Automation frees up your team to focus on analysis and strategy instead of data compilation.
Several methods can achieve automated reporting. Connecting your marketing tools directly to your dashboard platform is often the most efficient approach. Many platforms offer integrations with popular advertising platforms, CRM systems, and analytics tools. This allows for real-time data syncing, ensuring your dashboard always reflects the current state of your marketing efforts.
Another option is using APIs to pull data from various sources into your dashboard. This offers more flexibility for custom integrations and complex data manipulations. Scheduled reporting is essential regardless of the chosen method. Set your dashboard to refresh at regular intervals, whether daily, weekly, or monthly, aligning with your reporting needs. This ensures stakeholders always have access to the latest information without manual intervention.
Using Dashboards in Team Meetings
Marketing dashboards play a crucial role in team meetings, providing a centralized view of key performance indicators (KPIs) and campaign progress. A well-designed dashboard eliminates the need for lengthy reports and allows for data-driven discussions.
Start by presenting a high-level overview of performance. This could include overall website traffic, lead generation, or conversion rates. Focus on the most important metrics relevant to the meeting’s objectives.
Then, use the dashboard to drill down into specific areas requiring attention. For example, if a campaign underperforms, the dashboard can quickly reveal which channels or demographics are contributing to the issue. This enables the team to identify bottlenecks and brainstorm solutions effectively.
Encourage interactive discussion around the data. Team members should feel comfortable asking questions, sharing insights, and proposing actions based on the dashboard’s findings. This collaborative approach fosters a shared understanding of performance and promotes alignment on strategies.
Finally, use the dashboard to track progress on action items from previous meetings. This ensures accountability and provides a visual representation of the team’s efforts toward achieving its goals.

